Ficheiro:Population and temperature.jpg
Fonte: Futuro Da Humanidade
Dimensões desta antevisão: 800 × 498 píxeis. Outras resoluções: 320 × 199 píxeis | 813 × 506 píxeis.
Ficheiro original (813 × 506 píxeis, tamanho: 144 kB, tipo MIME: image/jpeg)
Category:Photos and Images - Other
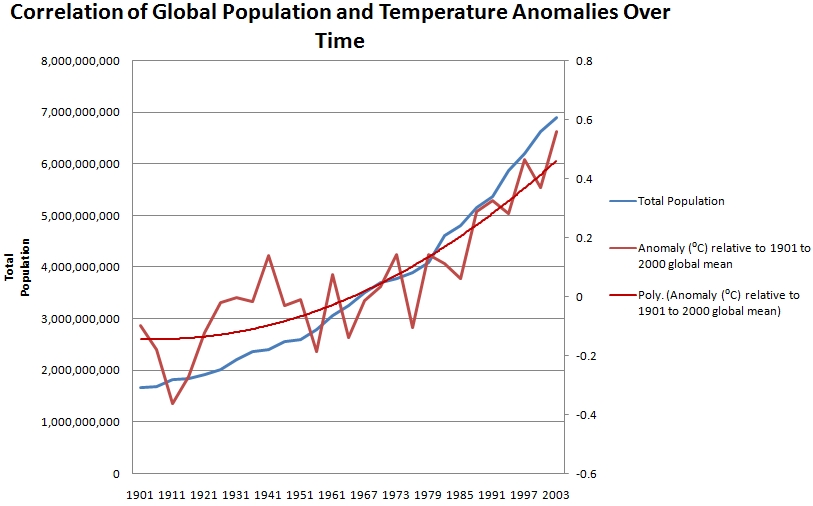
A graph showing the correlation between the rising human population of Earth and the global temperature difference to that of the 1901 to 2000 mean temperature.
Human population data courtesy Ptaah. See Overpopulation_Crusade#Earth_Population_Growth_Chart.
Temperature data courtesy National Climatic Data Center (NCDC), U.S. Dept of Commerce. http://www.ncdc.noaa.gov/oa/climate/research/anomalies/index.php
Histórico do ficheiro
Clique uma data e hora para ver o ficheiro tal como ele se encontrava nessa altura.
| Data e hora | Miniatura | Dimensões | Utilizador | Comentário | |
|---|---|---|---|---|---|
| atual | 04h55min de 10 de julho de 2009 | | 813 × 506 (144 kB) | Jamesm (discussão | contribs) | A graph showing the correlation between the rising human population of Earth and the global temperature difference to that of the 1901 to 2000 mean temperature. Human population data courtesy Ptaah. See [[Overpopulation_Crusade#Earth_Population_Growt |
Não pode substituir este ficheiro.
Utilização local do ficheiro
Não há nenhuma página que use este ficheiro.